The "Service Monitor" page provides an overview of the configuration of the servers and some real time figures on the connections, packets and data being distributed by the Load Balancer to the cluster.
This can be found by selecting the "Load Balancer" options under the "Services" from the main Overview Page in your Memset Control Panel. The list that follows will contain all of the Load Balancer Products within your Memset Account, for the Load Balancer you wish to Configure, select the "Manage" option and the the "Service Monitor" option.
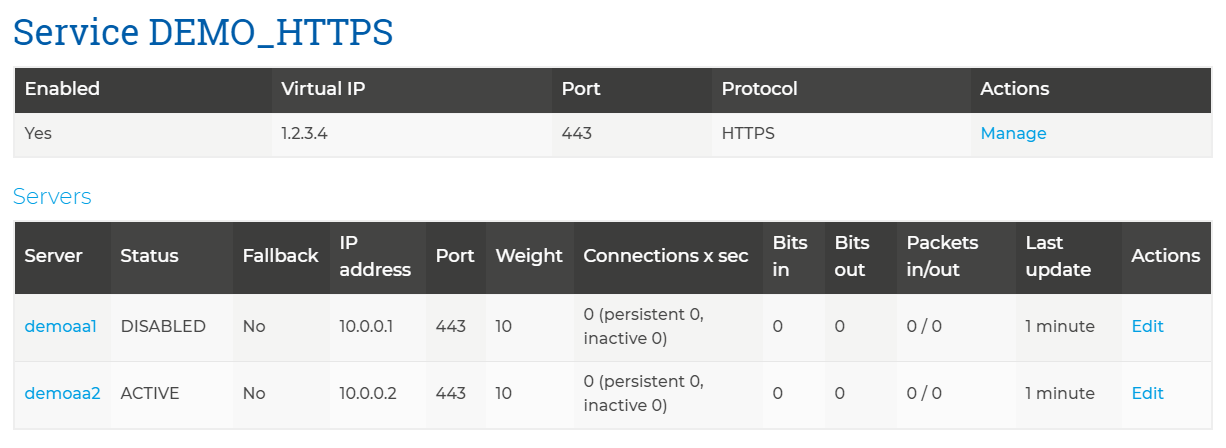
The following is a screen shot of the service monitoring page for a pair of active servers:
This page shows the number of incoming connections per second, the bits received and sent and the number of packets received and sent, in addition to the current configuration of the servers in the cluster. The number of connections per second represents the number times a client is requesting an object such as image, html page etc.
An active server is one that is actively accepting connection and has not failed the last health check.
This page is updated automatically every few seconds so does not require refreshing to get the latest information.